


The Lifeblood of Markets : How Liquidity Shapes Bitcoin

Preface
Liquidity in financial markets is like the bloodstream in the human body. Just as blood delivers oxygen and nutrients to vital organs, liquidity fuels economic activity by ensuring capital flows efficiently through the system. When liquidity is abundant, market thrive just like a well oxygenated body performs at its peak. But when liquidity tightens, markets can experience distress, similar to how the body weakens under poor circulation.
Understanding liquidity is crucial for timing risk exposure in financial markets. By recognizing when liquidity is expanding or contracting, investors can make more informed decisions about when to go “risk-on” or “risk-off” in risk assets like bitcoin. This article explores the essence of liquidity, how it is injected or withdrawn from the financial system, and its impact on risk assets like bitcoin. We will also discuss the relationship between liquidity growth and GDP growth, providing a deeper perspective on why liquidity matters in shaping market cycles.

What Is Liquidity ?
Liquidity refers to the availability of money and credit in the financial system, influencing market stability, asset prices, and economic activity. A key way to understand liquidity is through the money supply, which is categorized into different measures based on accessibility and usage:
M1 Money Supply = The most liquid form of money, consisting of physical cash, coins, and demand deposits such as checking accounts. M1 represents funds that can be immediately used for transaction without restrictions.
M2 Money Supply = A broader measure that includes M1 along with saving accounts, small time deposits, and retail money market funds. While not as instantly accessible as M1, these assets can still be converted into cash relatively quickly.
M3 Money Supply = The most comprehensive measure of money supply, encompassing M2 along with large time deposits, institutional money market funds, and other less liquid financial assets. M3 reflects long-term liquidity and is often associated with capital allocation for investments rather than immediate spending.
M2 is a key liquidity indicator as it balances immediate cash (M1) with near-liquid assets that can be quickly converted into cash. More reflective of consumer and business liquidity than M1 and more responsive to economic shifts than M3, M2 provides insight into credit availability, spending power, and monetary conditions. Central banks monitor M2 closely, as its fluctuations can signal inflationary pressures and broader economic trends.

How Liquidity Is Controlled
Liquidity in the financial system is regulated by central banks, which manage the money supply to ensure economic stability. Major central banks such as the Federal Reserve (Fed), European Central Bank (ECB), Bank of Japan (BoJ), and People’s Bank of China (PBoC) adjust liquidity to either stimulate growth or preventing overheating. Their policies influence borrowing, spending, and investment.
When do central banks inject liquidity ?
Central banks increase liquidity when the economy faces slowdowns, ensuring businesses and consumers have access to credit and market remain stable. This typically happens during:
Recessions or slow economic growth → When demand falls, businesses cut investments, and unemployment rises, central banks boost liquidity to reignite economic activity.
Financial crises and market distruptions → In times of crisis (e.g, 2008 financial crisis, COVID-19 pandemic), central banks inject liquidity to prevent systemic failures and restore market confidence.
Deflationary pressures → If inflation is too low or turns negative, it indicates weak purchasing power. In response, central banks expand the money supply to prevent a deflationary spiral, where falling prices reduce consumption and investment.
Here are some ways central banks increase the liquidity:
Lowering interest rates → Reduces borrowing costs, encouraging businesses and consumers to take loans and spend.
Quantitative Easing (QE) → Central banks purchase government bonds, securities, and other assets to inject money into the banking system, often accompanied by printing new money to expand the money supply.
Reducing reserve requirements → Banks are required to hold less cash in reserves, allowing them to lend more.
When do central banks tighten liquidity ?
Central banks tighten liquidity when inflation rises too quickly, asset bubbles form, or the economy overheats, central banks restrict liquidity to stabilize prices and financial markets. This happens when:
High inflation → Excessive liquidity can drive up prices. Central banks tighten liquidity to slow demand and control inflation.
Economic overheating → When rapid growth to excessive borrowing and risky investments, reducing liquidity helps prevent financial instability.
Asset bubbles → If stock, real estate, or other asset prices rise too quickly due to speculation, central banks may intervene to avoid market crashes.
Here are some ways central banks tighten the liquidity:
Raising interest rates → Makes borrowing more expensive, reducing excessive lending and spending.
Quantitative Tightening (QT) → Central banks sell assets or allow bonds to mature without reinvesting, reducing the money supply.
Increasing reserve requirements → Banks must hold more cash in reserves, limiting their ability to lend.
How Liquidity Affects Bitcoin
Liquidity plays a crucial role in shaping the performance of risk assets, including bitcoin. As a high risk asset, bitcoin is highly sensitive to changes in liquidity conditions driven by central bank policies and macroeconomic trends. When central banks inject liquidity into the financial system through lower interest rates, Quantitative Easing (QE), or reduced reserve requirements, capital flows into risk assets like bitcoin in search of higher returns. Conversely, when central banks tighten liquidity by raising rates, Quantitative Tightening (QT), or increasing reserve requirements, bitcoin and other risk assets face downward pressure.
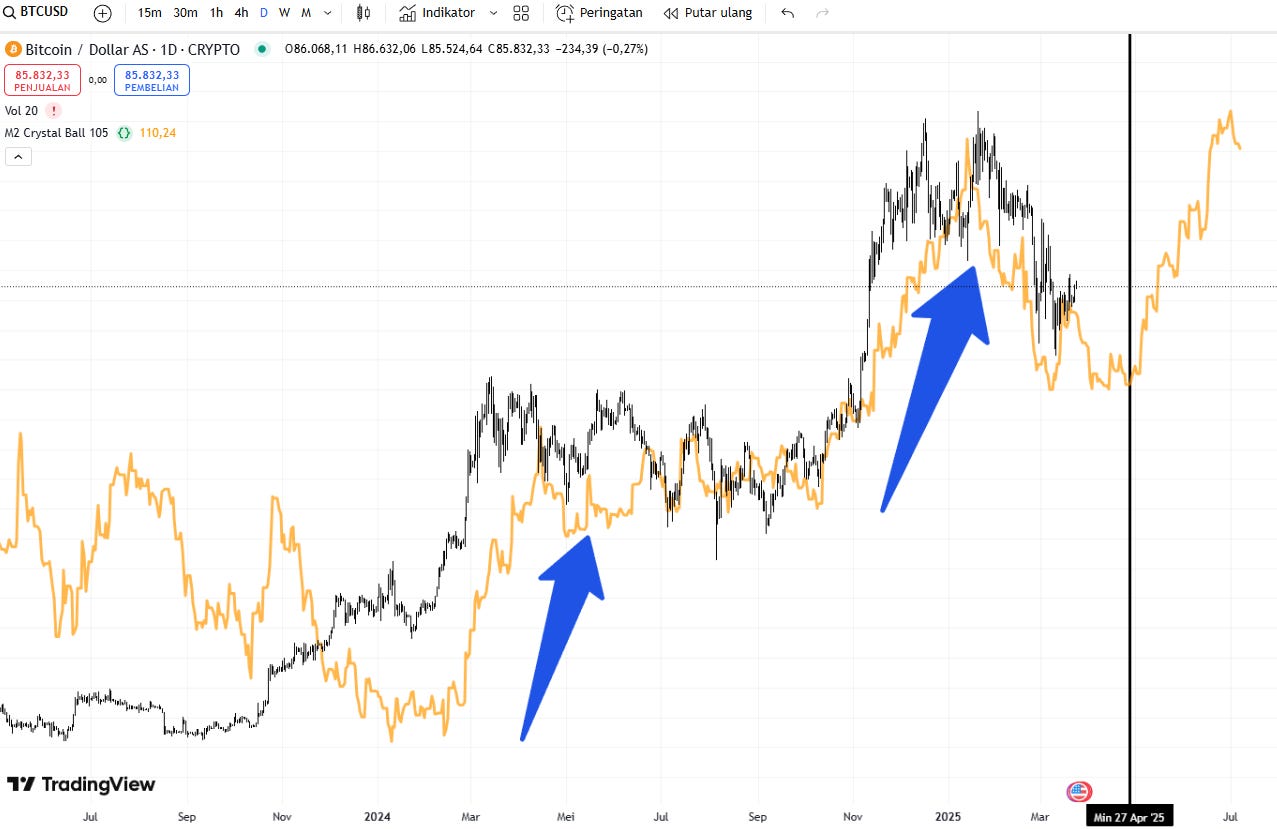
The orange line above represents Global M2 Money Supply, covering various regions such as APAC, Middle East, Europe, North America, Latin America, and Africa. Some may wonder why the orange line appears to be offset into the future (in this case, by 105 days). This is due to the lag effect, newly printed liquidity takes time to flow through the economy, and those who received the money first gain an advantage before inflation fully kicks in.
As indicated by the blue arrows, each significant leg up in bitcoin price is consistently preceded by an increase in the Global M2 Money Supply. While this correlation is visually apparent, it can also be mathematically verified, particularly in determining the most accurate time offset.

Through calculations, it is found that the offset that achieves the highest score is 105 days. This score represents the cumulative correlation values across various time periods, with longer periods exceeding 360 days being weighted proportionally lower. The scoring method allows for a standardized comparison of different offsets on the same day, helping to identify the most relevant liquidity impact timeframe for bitcoin.
Mathematical analysis indicates that the optimal offset for liquidity impact on bitcoin is 105 days, suggesting that liquidity changes take approximately this time to fully spill over into bitcoin. This delay reflects the gradual transmission of excess money supply through the financial system before reaching speculative markets like bitcoin. One key factor influencing how much liquidity flows into risk assets is GDP growth. When M2 Money Supply growth exceeds GDP growth, there is surplus liquidity after meeting the needs of the real economy. This excess capital often finds its way into speculative assets, including bitcoin, driving up prices. Conversely, when GDP growth outpaces M2 growth, less liquidity remains for risk assets, potentially leading to weaker price momentum. Understanding this relationship helps in assessing bitcoin’s sensitivity to monetary conditions and broader economic cycles.
Closure
Understanding liquidity cycles is crucial for navigating bitcoin’s price movements. Historical data suggests that bitcoin benefits from rising liquidity, particularly during periods of monetary expansion. Investors looking to time their exposure should consider liquidity growth as a signal for a "risk-on" phase, where bitcoin and other risk assets tend to perform well. Conversely, periods of tightening liquidity, marked by rising interest rates, Quantitative Tightening (QT), or slowing M2 growth—typically signal a "risk-off" environment, where bitcoin faces downward pressure.
Looking ahead, there is potential for a significant liquidity surge acting as a catalyst. Based on the 105-day offset correlation analysis, the next major liquidity wave is projected to begin in late April 2025. This influx could provide the necessary fuel for bitcoin’s price to enter the last leg of the bull run, similar to past cycles where liquidity expansion has driven parabolic price movements.
Hello, itu M2 Crystal Ball 105 is self made from M2 money supply offset by 105 days? Thanks in advance!